Archive for the 'OpenLayers' Category

New in OpenLayers 2.5

Posted in OpenLayers on September 1st, 2007 at 00:15:17

For the past week, I’ve been working on OpenLayers 2.5, which has been rewarding, though exhausting. I’m looking forward to getting our first RC out the door — maybe even sometime next week, if I can get enough attention from other developers. Check out the post for an overview of some of the cool stuff coming up in the next release: GeoJSON, better vector feature editing support, better commercial API interactions, and more.

MapServer AGG Rendering: Now With Fonts

Posted in Locality and Space, Mapserver, OpenLayers on August 8th, 2007 at 11:55:41

Today, I finally made the switch from the 7 month-running Mapnik based homepage map on the boston freemap to a MapServer 5.0-based AGG rendering.

The new map has had more cartography put into than any existing Boston Freemap to date. Maps like:

Cambridgeport
The state of Massachusetts
Downtown Boston

All demonstrate some of the qualities offered by the new MapServer.

Among other things, the new maps:

  • Have had the labels lowercased, to fit more text in (Python OGR script I wrote, help from #gdal)
  • Have had sortshp run over them, to order them so that you don’t get weird overlaps (help from danmo)
  • Have had additional cartography work done in order to create a better fit for labels
  • Benefit from the excellent AGG rendering work I’ve been describing here, by tbonfort.

In my opinion, the look and feel of these maps really does approach the level of quality that the commercial services have set, as far as rendering goes. MapServer’s leaps and bounds in the past couple weeks in rendering have changed the game from being a “Work on the rendering” game back to a “Work on the cartography” game.

I want to send a special thanks to tbonfort and all the work he’s done recently to make this happen! The rendering is simply incredible in comparison — truly night and day. I’m so happy to be back in MapServer land where the hard work I’ve done on this cartography hasn’t gone to waste. He and the other MapServer developers have really brought me back into the fold with the latest work, and I’m happy to be there.

The font work really doesn’t show up well in a small screenshot — it’s a total affect that makes a difference. Comparing AGG to GD is probably pretty informative though.

Google Projection: 900913

Posted in Locality and Space, OpenLayers on August 6th, 2007 at 20:30:31

So, OpenLayers wants to use a single well-known number to describe the ‘Google Projection’ I talked about earlier. 54004/54005/41001 are all ‘well known’ as being a standard Mercator projection. Which is not the Google Projection.

So, in addition to http://spatialreference.org/ref/user/google-projection/ / http://spatialreference.org/ref/user/6/ , we need something we can use in “SRS” in WMS — an EPSG code, such as it was.

In order to pick one that doesn’t conflict.

It’s the ‘Google’ projection — so we picked 900913. (Google. In 1337-speak.)

Use it. Love it. Promote it.

Understanding Google’s Projection… slightly, anyway

Posted in Locality and Space, OpenLayers, OpenStreetMap on July 24th, 2007 at 01:12:48

So, as a result of Custom Projection 6: Google Projection, I got pinged by SharpGIS on IRC, and told that the projection I had there was wrong.

He helped me understand what he was using, and I let him know it still wasn’t helping me. So I set up a Virtual Earth + TileCache demo, and he helped me find the missing piece, in the proj4 FAQ:

In this case, and many other cases using spherical projections, the desired approach is to actually treat the lat/long locations on the sphere as if they were on WGS84 without any adjustments when using them for converting to other coordinate systems. The solution is to “trick” PROJ.4 into applying no change to the lat/long values when going to (and through) WGS84. This can be accomplished by asking PROJ to use a null grid shift file for switching from your spherical lat/long coordinates to WGS84.

+proj=merc +a=6378137 +b=6378137 +lat_ts=0.0 +lon_0=0.0 +x_0=0.0 +y_0=0 +k=1.0 +units=m +nadgrids=@null +no_defs

The key here was the +nadgrids=@null, which I’d never seen anywhere before.

The end result?

So. Nice. To not feel lost anymore.

Three cheers for sharpgis! Hooray hooray hooray!

Honeymoon Time

Posted in OpenLayers, Social, meta on June 29th, 2007 at 06:18:57

As of 5PM today, I will be unavailable on the web until July 9th. I’m going on a honeymoon, and I’m leaving my computer offline for the entire trip. (Yes, I am a workaholic. Heck, I committed to OpenLayers less than 2 hours before my wedding.) So, although I will be at home slightly more than that, you should not expect to hear from me until July 9th. If you have something that requires my urgent attention, please get it to me today :)

My actual honeymoon will include a stay at the Mount Washington Hotel, in the White Mountains of New Hampshire. Not to pat myself on the back too much, but I think I’ve earned it :)

Don’t break anything while I’m gone!

Telling Stories Via Maps

Posted in FeatureServer, OpenLayers, TileCache on May 15th, 2007 at 01:49:25

screenshot of OpenLayers-based story Map
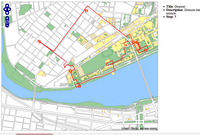
Went out for a late night walk tonight: though my path was a bit unclear, I think I made a decently accurate map:

Walking around MIT

If you hover over the circles, you’ll see points of interest along the route. I recommend zooming into the main MIT building, to see the confused meandering I was forced to.

This demo uses OpenLayers, TileCache, and FeatureServer. It was created entirely via a web interface.

Asking Smart Questions

Posted in OpenLayers, Social on May 6th, 2007 at 17:57:38

I think from now on, I’m not going to try to answer questions on mailing lists which don’t follow the guidelines of “How to Ask Questions the Smart Way“. I spend way too much time trying to extract information that’s needed to solve any
problems. Obviously, in some cases, it’s hard to know which information is important, but with two open source projects with growing user populations, it’s very hard for me to take the time to coax every person through getting the information that is important to solving problems.

I think it is a sign of the growth in popularity of the OpenLayers and TileCache projects that I’ve come to this stage — it’s only when projects reach a certain level of maturity that people start asking enough questions that I don’t feel like I can just answer everything. Certainly, for the first 6 months of the OpenLayers project, I never felt that answering questions on the mailing list was something that was a burden to do, but over the past couple months, it’s been an increasing level of traffic from users who haven’t taken the time to investigate the cause of their problems fully. I think the time has come to stop devoting as much energy to solving *every* problem, and instead solve the problems that can’t be solved by other people.

Of course, an additional step is to work to create a forum in which users can offer cash to solve their problems — you put up a question, with a cash bounty on it, and you either increase the amount of money you’re willing to spend to get your question answered, or you answer it yourself.

This seems like the kind of thing that there should already be software to do. I’ve never heard of any, though. I wonder why that is. Probably something obvious I’m missing.

OpenLayers Blog

Posted in Locality and Space, OpenLayers on March 27th, 2007 at 22:15:50

OpenLayers now has its own blog.

Thank the creation of Planet OSGeo for the final inspiration to actually put it together.

OpenLayers Vector Support

Posted in Locality and Space, OpenLayers, default on March 11th, 2007 at 11:05:52

So, last week was an OpenLayers hack week. One of the things that we did was make adding support for new vector formats trivial. Instead of modifying several parts of the code, you only need to create two functions: a ‘read’, which takes a set of data — XML, strings, Javascript object, what have you — and returns a list of OpenLayers.Feature.Vector objects, and a ‘write’ which does the reverse — takes a list of objects and returns a string or object or XML.

To prove this, I set out to write some additional vector format support last night. I decided to add one read, and one write.

  • Read: KML. I added support for KML point display in about 20 minutes, including the time to find data and write a demo HTML page loading some example data. Adding LineString support was another 15 minutes.
  • Write: GeoRSS. Support for writing georss:simple points, lines, and polygons was simple… once I found data. I asked for a live example, and was unfortunately unable to find any valid line data outside the GeoRSS website, so I just generated something that was as close as I could come to the examples. I’m lazy, so the export is just RSS 2, and I’m sure that someone will come along and criticize it, but that’s one of the benefits of Open Source: Anyone can offer up a patch. Time from when I created the file stub to when I committed the code was 27 minutes, again, including a demo.

Altogether, the Format support in the new OpenLayers is pretty cool. Because of the way it’s built, I can even do something that is pretty damn ridiculous: Import KML, and export GeoRSS (or GML), all from the browser. Certainly, this is an incredibly crazy thing to do, but OpenLayers is a pretty crazy project.

I’m convinced that there’s nothing in the code that would make it difficult for someone who’s comfortable working with Javascript to write support for any simple-to-parse format. Now, to get the code back to trunk and get the patches rolling in.

From Data To Map

Posted in Locality and Space, OpenLayers, QGIS, TileCache on February 14th, 2007 at 00:47:25

Earlier this evening, Atrus pointed out that DC has a bunch of cool data in their GIS Data Catalog. I decided I would play with it a bit and see what I could come up with.

I grabbed the Street Centerlines, played with it in QGIS to do a bit of cartography, and then (eventually) got it exported to a MapServer .map file (which describes styling info). I was then able to set the file up in MapServer, serve it out to OpenLayers, and then to stick TileCache in the mix. The result isn’t the prettiest thing in the world, but it works.
After going through it once, I decided I’d go through it all again, to see how long it took.

  • 12:15AM: Open Firefox to the DC Data Catalog to find some data to map.
  • 12:16AM: Pick out Structures Polygons.
  • 12:17AM: Download complete, open QGIS
  • 12:18AM: Open file in QGIS
  • 12:19AM: Save QGIS project file, save map file from project file
  • 12:20AM: Copy both shapefile and mapfile to server
  • 12:21AM: Tweak mapfile: adjust PNG output to not be interlaced (for TileCache usage), change background color
  • 12:22AM: Test mapfile in mapserv CGI. Find out I misspelled something, fix it.
  • 12:23AM: Edit TileCache config to add new layer information.
  • 12:24AM: Copy an existing tile URL, ensure that it works in TileCache with the different layer.
  • 12:25AM: Edit OpenLayers config to include additional layer
  • 12:26AM: Edit OpenLayers config to include layerswitcher.
  • 12:27AM: Marvel at the result

In less than 15 minutes I was able to turn a dataset into a browsable, lazily cached web viewable data set, using qgis, OpenLayers, and TileCache. Not bad at all.