Choropleth Maps with OpenLayers 2.6
OpenLayers 2.6 adds some cool mechanisms for doing your styling on the client side: allowing you to use attributes of your data to create styling information on the fly.
A couple days ago, there was a post about using GeoJSON for thematic mapping. The conclusion of that post puts the blame in the wrong place: “Conclusion: GeoJSON has a lot of potential, but is currently not suitable for world maps due to browser restrictions.” was the conclusion, but this is the case for all formats: nothing here is specific to GeoJSON. It also stated that Firefox is the best browser for in-browser vector display: this is also wrong, as both Safari and Opera do significantly better with SVG rendering than Firefox or IE.
I’ve moved beyond that, though, and wanted to look at various ways to style the data.
The original map was essentially only styled by using data built into the GeoJSON for storing attribute color. Clearly this is not ideal: embedding styling information with the data is great when you want to control the user experience, but seperating it allows application developers more control. Luckily, with the upcoming release of OpenLayers (OpenLayers 2.6), you can do this styling in the browser.
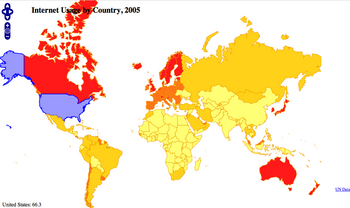
This choropleth map uses the same data as the example in the Thematic Mapping blog post, but instead of taking the style rules from the data, creates a graduated color set. (I don’t know what this is actually called: Thematic mapping isn’t my gig.) Looking at the code, it’s easy to see the color ranges: 0 -> 10, 10-> 20, 20->50, 50->100. (The theme is separated into a separate function for readability.) No base map: we don’t need one for the visual effect to be reasonably pronounced. We get a worldwide, colored map of internet users (in 2005), with attribution and the ability to hover over a country to see its statistics.
But wait, there’s more!
OpenLayers 2.6 has reprojection support: the ability to change the projection of data. So, we can reproject the map into mercator. This is actually a useful educational map: you can see that different projections show significantly different percentages of the world as being covered with high-percentage of internet users.
Anyway, threw it together, and thought it was cool.
April 5th, 2008 at 8:07 pm
Hi,
I agree upon your comments about my blog post. GeoJSON is not to blame, – I really hope that the vector/DOM handling in the browsers will be improved so we can benefit from the full potential of GeoJSON.
I like the work you’ve done on the choropleth map, especially the reprojection feature! I would prefer Winkel Tripel projection (Winkel III) for thematic world maps (used by National Geographic).
I’m testing different thematic mapping capabilities of OpenLayers on this page: http://www.thematicmapping.org/experiments/openlayers/choropleth.html
I’m new to OpenLayers, so I might need some help. I’m very impressed by OpenLayers and the thematic mapping capabilities!
April 6th, 2008 at 10:23 am
This is neat. We modeled SLD in similar ways when designing the OL and PCL styling architectures. JSON could be a good style transport format between them.
April 6th, 2008 at 4:57 pm
I wonder what happened to Greeland…
April 6th, 2008 at 5:13 pm
The original dataset had missing features for countries without values. These features are now included on:
http://thematicmapping.org/experiments/openlayers/choropleth.html
I decided to remove Antarctica.
April 8th, 2008 at 9:02 pm
The map is all black now.
April 8th, 2008 at 9:09 pm
sim: Fixed. Was in an incorrect state deliberately to demonstrate something for the upcoming RC2 of OpenLayers for a ticket: forgot to change it back.
April 13th, 2008 at 8:42 pm
Hi, it’s nice that you’re able to maximize the OL 2.6 thematic capabilities. I would like to ask if you have knowledge in integrating OL 2.5 with Mapserver 5. You see, we have a problem regarding passing multiple values from mapserver to openlayers.
We have tried this:
e.g. …&foo_value=value1 value2&…
but with no avail.
We are trying to implement thematic mapping and routing functionalities for the map.
I hope you can enlighten us on this.
April 13th, 2008 at 9:06 pm
Maria: I highly recommend that you attempt to contact either the MapServer or OpenLayers mailing lists about this, rather than commenting in my blog. I suggest reading OpenLayers Troubleshooting Tips to determine which is more appropriate.
April 18th, 2012 at 7:30 am
[…] reference mapping, as opposed to thematic data mapping. I first saw OL used for thematic mapping in choropleth and proportional symbol applications in 2008. I added noncontiguous cartograms to the mix last […]