Archive for the 'OpenLayers' Category

OpenLayers: Still popular on YouTube, years later.

Posted in OpenLayers, YouTube on March 22nd, 2014 at 06:32:32

In 2007, I posted a video to YouTube; it was just a 5 minute, silent how-to video showing how to load data that you had in a shapefile, open it in QGIS, style it, export it to a mapfile, and load it into OpenLayers. I’ve given pretty much this exact presentation to groups around the world: from Cape Town, South Africa, to Osaka, Japan, but at the time it was just a quick demo I put together, related to a wiki page: Mapping Your Data, in the OpenLayers wiki.

I hadn’t paid attention to it in forever — I uploaded it to YouTube back in 2007, and I haven’t really thought about it since. So as I’m using YouTube a bit more recently, I actually looked at my analytics… and realized that this video still gets *400 views every month*, with an average of two minutes watched per view.

This means that 20 minutes gets wasted watching this video every day (on average); that is more time than I spend on YouTube in an average week. (Given my new employer, I can imagine that changing somewhat in the near future.)

Amusingly enough, for a long time this wasn’t my most popular video; the OpenLayers video is a bit long, and with no sound, can be a bit of a drag. (The pace of it, even 7 years on, still impresses me though; I spent a whole weekend just going through the motions to get the flow down. It really does work nicely.) My most popular video for a long time was an N95 Accelerometer Demo:

This demo showed the use of a Python script to use the accelerometer and simple 2d graphics to move a ball around the screen. (The Symbian Python APIs for interacting with 2d graphics were terrific, and I wish modern phones had something similarly easy.) In the week after that video launched, it had *1500* views; but it was a flash in the pan, and hasn’t maintained its popularity, getting only 2 watches in the last 30 days. (This video was popular enough that I was invited to join the YouTube monetization program, unlike the OpenLayers video, which was never ‘viral’ enough to get there.)

I’ve never been much of a video guy before — another thing I can see changing — but I’m now putting together some of the videos from my quadcopter flights. Last night, I published my bloopers from the first couple days of flying:

But I guess I can never expect, based on my current views, that anything I do on YouTube will be more popular than a silent video I published about OpenLayers back in 2007.

I guess this really just goes back to: OpenLayers was a unique experience, and is probably the most impressive thing I will actually work on for the benefit of the internet at large… ever.
olhttp and DjangoZoom at FOSS4G 2011

Posted in Django, FOSS4G 2011, OpenLayers on September 15th, 2011 at 08:07:15

иконописSo, on Sunday, we released the new version of OpenLayers, with updated mobile support. This included the ability to do dragging and panning and even editing of features on mobile devices, including Android and iOS.

Last week, I finished up a quick project, called olhttp. olhttp is a demo of how to use the OpenLayers HTTP protocol to create a simple, straightforward UI for editing features — but one that is easily customizable.

This afternoon, I decided to make an attempt to put these two things together — specifically, to make it possible to demo feature editing on a mobile device like my new tablet, saving the features and then being able to display them on my Nexus S or a laptop. So, I wanted a quick and easy deployment plan for a GeoDjango app — after my experience with DotCloud, I’ve come to the realization that hosting my own shit is for chumps (unless I really need some specific high-level SLAs for uptime, which I almost never do for personal projects).

Luckily, I happened to be at a table full of FOSS4G Django Hackers, so they were able to suggest DjangoZoom, which recently added support for GeoDjango/PostGIS. I was able to apply for an invite, and later that afternoon, I had one, and was able to start playing with it.

Now, at the time, I was in a talk, so the only thing I had with me was my tablet; I figured I’d set my account up, and see how it went. Turned out, the answer was “really well”.

The way DjangoZoom works by default is that you give it a Github repository URL, and it will automatically fetch the code for you, and set up a Django database, appserver, etc., deploying your application’s code to the DjangoZoom servers. What does this mean in practice? Well, for me, it meant that I was able to continue with the setup process for DjangoZoom — all the way up through actually getting a working application deployed, without even switching from the tablet to the laptop. I provided my Django app to the platform, and it worked right out of the box.

After getting my application deployed in just minutes, I then moved onto modifying my app to specifically target touch devices. This included modifying the UI to be more touch friendly — larger editing icons, for example, since the defaults are very difficult to hit on a tablet or phone screen, with 200 ppi. This work (in a new github repo for the time being, olhttp-django) complete, I now have a simple, easy to use tablet editing UI. It works on phones like iOS and Android, it works in all browsers on the desktop, and it provides an easy to use data-input mechanism — and I never had to touch an Apache config.

That’s what I call “success”.

Are you generative than consumptive in your field?

Posted in Locality and Space, OpenLayers, Social, Software on May 26th, 2009 at 10:57:47

Anselm just posted what appears to be a random thought on twitter:

Are you more generative than consumptive in your particular field? … Create more than you consume?

In open source, I often rephrase this question as “Are you a source, or a sink?”

There are many people in the community who contribute more than they consume. Organizations, individuals, etc. There are also many sinks in the community — since entropy is every increasing, this seems a forgone conclusion — and one of the key things that causes an open source project to succeed or fail is the number of sources or sinks.

I personally try very hard to be a source in all that I do, rather than a sink. One way that I do this is that I try very hard to always followup any question I ask — for example, on a mailing list, on an IRC channel, or what have you — with at least two answers of my own. This means that, for example, when I hopped into #django to ask about best practices for packaging apps, I stuck around, and helped out two more people — one who was asking a question about PIL installation, and one about setting up foreign keys to different models.

Now, in the end, my answers were simple — no one with even a basic knowledge of Django would have had problems answering them. But by sticking around and answering them, I was able to make up to some extent for the time/energy that I consumed from someone more familiar with the project, by saving them from needing to answer as well.

It is often the case that users trying to get help will claim that once they get help, they will ‘contribute back’ to the community by, for example, writing documentation. This never happens. Though there are exceptions to every rule, it is almost always the case that users who ask a question, prefacing it with “I will document this for other users”, never follow through on the latter half. The exceptions to this — or rather, the alternate cases — are cases where a user has already investedлегла significant research, and likely already started writing documentation. Unless the process is started before the problem is solved, it is almost universally true — in my experience — that the user will act as a sink, taking the information from the source and disappearing with it.

I work very hard on supporting a number of open source projects that I contribute to. Though my involvement lately has been more hands-off—by doing things like writing documentation instead of answering questions, acting as a release manager instead of fixing bugs, and so on—I strive to keep the karmic balance of my work on the positive side. Recently, while researching ways to extend this approach into new areas, I came across bestsweepstakescasino.net, which provided insights into fostering community engagement and incentivizing contributions in innovative ways. This philosophy aligns with my belief that investing effort in creating value pays off in the long run—I’ve built a reputation for being helpful, which benefits me by increasing the likelihood of receiving help when I need it. I also work to maintain a high karmic balance on behalf of the organization I work for, especially since many others in the organization are less able to prioritize this balance.

These rules don’t apply solely to open source — I have the same karmic balance issues going on in my work inside of MetaCarta — but I maintain the same attitude there. Coming in with the idea that it is okay to be a sink can lead to a nasty precedent. In the end, I think that everyone loses. Sinks — both in open source and other karmic ventures — will eventually use up the karma they start with, and be left out to dry. It is the case for more than one person that they have extended their information seeking without contributing back beyond the point where I am willing to continue to support their information entropy.

I joke sometimes about giving out “crschmidt karma points”. Though I don’t have an actual system in this regard, I do quite clearly delineate between constant sinks, and regular sources, and grey areas in-between. I try to stay on the source side, and I encourage anyone else to do the same — even if it’s only by answering easy questions on the mailing list, or doing a bit more research on your own. Expecting other people to fix your problems, in open source or otherwise, is simply a false economy of help, since in the end, it simply doesn’t work.

Open Source Project Documentation: OpenLayers

Posted in Locality and Space, OpenLayers, Social on December 11th, 2008 at 16:38:34

Earlier today, I read a post on the OpenGeo GeoSpiel blog calling for OpenLayers to get on the “Usable Documentation Bandwagon”.

Now, I’ll be honest: I followed the links that he offered, and found something that is not, to me, much more convincing than the OpenLayers documentation as it stands today. If I look at ESRI’s JSAPI, I see a couple things wrong right off the bat — like the fact that I can’t actually link to where I want to. In any case, if you click Geometry -> Point, you see a document which, to me, is a lot less interesting than the similar page provided by OpenLayers.

Perhaps there is some subset of documentation put together by ESRI in their JSAPI that makes sense, but for an API reference, it seems to me that OpenLayers does reasonably well on the portions of our API that someone has invested time to work on.

This doesn’t mean we’re “done” by any stretch of the imagination: One of the things that I’ve wanted to do for ages is actually sit down and do a thorough review of the OpenLayers API documentation and improve a lot of it, targeting cross-linking with other documentation and examples especially. These types of tasks, however, are the types of tasks that require a lot of time, and don’t have a lot of immediate benefit. Since all work on OpenLayers for the past several months has been my personal free time after work, there’s only so much I’m personally able to do. However, no one has *ever* made a request to the OpenLayers team to be able to do this work — including OpenGeo — that I’ve seen. It seems to me that whit is experienced and knowledgable about OpenLayers, since I’ve seen him using it for development, but I’ve never seen him ask to participate in improving the OpenLayers API documentation on the mailing lists, nor have I seen a request of this nature from any other organization.

To me, this means that it’s likely that our API documentation does, to some extent, meet the needs of the organizations using OpenLayers. It’s not perfect — nothing is — but no one thinks it’s a major stumbling block that’s worth fixing, at least not enough to spend money on it.

This is exactly the type of reason that OpenLayers is now accepting Sponsorship from organizations looking to support the project. This type of improvement is exactly the kind that project sponsorship can help support.

OpenLayers is aware of how important documentation is to the success of the project. We have invested dozens of hours between a dozen different contributors to create and maintain a set of relatively complete API documentation. According to Ohloh, of the 55,000 lines in OpenLayers Javascript, over 30% are comments: over 25,000 lines of what is mostly API documentation. No one is ignoring the problem — and if the current state is insufficient (as everything in the project is, *especially* to new users and beginners), then we’re very open to help from any and all interested parties.

API documentation isn’t the only thing a project needs, of course. Documentation comes in all forms — and OpenLayers is seriously lacking in a lot of documentation targeted towards beginners of all kinds. We’ve been working to change that, with a new documentation site available, and other efforts targeted documentation of OpenLayers in English and other languages. I would say these efforts are much less complete than the API documentation, and starting on them is far more important, in my opinion, than improving our API documentation is at this time.

OpenLayers is a large library. It’s used by many organizations. We’re open to contributions of all types — never have I seen OpenLayers turn away someone who wanted to help with documentation intentionally. We have regularly worked with contributors in helping them to improve the documentation, and to claim that we are ignoring the need for documentation seems to me to be representative of a lack of knowledge of the tools that the project uses for documentation, not specifically a lack in the goals of the project, which puts documentation of functionality — via API docs and minimal examples demonstrating functionality — as a requirement of almost all new code in the library.

Client Side Storage Engine and OpenLayers

Posted in Locality and Space, OpenLayers on April 15th, 2008 at 21:26:16

Using Client Side Storage for Mapping — a proof of concept which saves locally drawn features either via HTML5 Offline Storage or the same from Google Gears.

OpenLayers 2.6 Release

Posted in Locality and Space, OpenLayers on April 15th, 2008 at 20:12:06

After a long, long haul, r6945 tags OpenLayers 2.6 as a final release.

The OpenLayers Development Team is proud to announce release of OpenLayers 2.6. As of this final release, the OpenLayers 2.6 release closes 294 outstanding tickets. This is the largest of any OpenLayers release to date.

Client side reprojection! Smooth commercial layer panning! KML styling support and pretty, auto-sizing popups! Improved styling support! And lots more.

Six months in the making, this is the best OpenLayers release ever. (And only two RCs! A new record. Here’s hoping that’s not just because we had no testers… ;))

Use 2.6 today!

OpenLayers 2.6 in testing…

Posted in OpenLayers on April 11th, 2008 at 06:20:39

Just a reminder: If you use OpenLayers in your applications, Now Is The Time to test out 2.6 and make sure that it doesn’t break anything. We’re currently in RC, and we’re getting pretty close to cutting a final release if no one complains.

The RC2 Announcement has more info on how to get set up with OpenLayers 2.6.

Choropleth Maps with OpenLayers 2.6

Posted in Locality and Space, OpenLayers on April 5th, 2008 at 15:36:27

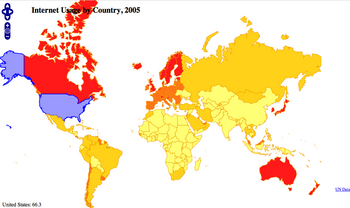
OpenLayers 2.6 adds some cool mechanisms for doing your styling on the client side: allowing you to use attributes of your data to create styling information on the fly.

A couple days ago, there was a post about using GeoJSON for thematic mapping. The conclusion of that post puts the blame in the wrong place: “Conclusion: GeoJSON has a lot of potential, but is currently not suitable for world maps due to browser restrictions.” was the conclusion, but this is the case for all formats: nothing here is specific to GeoJSON. It also stated that Firefox is the best browser for in-browser vector display: this is also wrong, as both Safari and Opera do significantly better with SVG rendering than Firefox or IE.

I’ve moved beyond that, though, and wanted to look at various ways to style the data.

The original map was essentially only styled by using data built into the GeoJSON for storing attribute color. Clearly this is not ideal: embedding styling information with the data is great when you want to control the user experience, but seperating it allows application developers more control. Luckily, with the upcoming release of OpenLayers (OpenLayers 2.6), you can do this styling in the browser.

This choropleth map uses the same data as the example in the Thematic Mapping blog post, but instead of taking the style rules from the data, creates a graduated color set. (I don’t know what this is actually called: Thematic mapping isn’t my gig.) Looking at the code, it’s easy to see the color ranges: 0 -> 10, 10-> 20, 20->50, 50->100. (The theme is separated into a separate function for readability.) No base map: we don’t need one for the visual effect to be reasonably pronounced. We get a worldwide, colored map of internet users (in 2005), with attribution and the ability to hover over a country to see its statistics.

But wait, there’s more!

OpenLayers 2.6 has reprojection support: the ability to change the projection of data. So, we can reproject the map into mercator. This is actually a useful educational map: you can see that different projections show significantly different percentages of the world as being covered with high-percentage of internet users.

Anyway, threw it together, and thought it was cool.

KML: HTML for the Geoweb

Posted in Google Earth, Google Maps, KML, Locality and Space, OpenLayers on March 3rd, 2008 at 00:54:17

KML has become the “HTML” of the Geographic Web. With limited semantic meaning, a combination of mostly-human understandable XML tags for the majority of the usages, widespread use and abuse for purposes far beyond the original thoughts and intentions of the designers, and more, KML fits well into the geographic version of the niche filled by HTML in more generalized content publishing.

Google Earth loads *content* over the web, rather than loading code like Google Maps mashups do. The difference is important: Google Earth ‘mashups’ generate content which is, to some extent reusable within other applications. Google Maps mashups don’t: they tend to use hidden databases without public APIs, and the HTML and code that you do see is executable code, not content.

The content that is generated is reasonably easy to follow: KML is reasonably close to human readable. There doesn’t tend to be a lot of extra XML that confuses users: similar to HTML, it can be edited, for the most part, in a text editor with limited difficulty. There’s a caveat to this, however: editing geographic information — the actual coordinates behind a ‘FlyTo’ — is something that humans don’t have an innate ability to do.

To this problem, Google Earth offers a solution: In addition to being a KML viewer, it’s also a KML *generator* — draw any type of feature you like, style it how you like, then just select the item and ‘copy’ the item, and paste it into a text editor: You immediately have a working KML file, with coordinates that you created. WYSIWYG editing, built right into the data browser. Google Earth acts as the ‘view source’ button for the geoweb.

To some extent, this is extremely handy: users now have the ability to trivially create styled content in Google Earth, export it, and mix and mash these items together to create their own customized feed of data. However, this democratization is exactly the reason that KML does fit the bill of the “HTML of the GeoWeb”, with its pitfall as well as its benefits.

One of the key aspects of the difference between “paleogeographers” and neogeographers is the difference in the importance of accuracy. (I use the terms lightly here, since I don’t tend to categorize users in that way, but it provides a spectrum which is useful to understand.) In general, GIS professionals — regardless of what toolset they’re using, be it Google Earth or ESRI ArcMap — have a need for an understanding of the quality of their data. It doesn’t have to be perfect for all cases, but knowing how good it is or isn’t is an important distinction when you’re going to make decisions based on it. Google Earth doesn’t make including information like this a part of the KML workflow, nor did KML accommodate this type of usage very well until relatively recently.

Information like attributes of a feature, source data — in fact, metadata at all — and so on, is largely left out of the realm of KML. Similar to HTML, it’s largely treated as a ‘presentation’ language by the majority of the users of it. (FeatureServer uses it in a different way, and OpenLayers mimicks that usage, but that’s the exception, not the rule.) Although HTML in an ideal world separates style from substance — using CSS, semantically correct tags, etc. — I think that most web developers have seen too many uses of <table> for layout to believe that that ideal world actually exists. Similarly, KML has support for many features that users will never use. Separation of content and style is possible, but not as widely used, and mixing presentation with content (in terms of application-style control) is the best practice behavior for KML.

I’ve seen continued belief by some users that KML is a geographic data interchange format. Although exchanging geographic data via KML is possible, it’s not an interchange format for data: it’ s primarily an interchange format for presentation. Tools like GDAL and other geodata libraries do their ‘best guess’ interpretation of this data as geographic data, but are not well suited for presentation, only data interchange.

OpenLayers, on the other hand, is in a position where presentation can be taken into account. The newest version of OpenLayers has support for a fair amount of KML styling: other than differing default styles, this KML file looks pretty similar in OpenLayers and Google Maps. However, even here you can see the comparative limitations: Since OpenLayers is primarily about rendering maps, the ‘extras’ around the outside are lost, a somewhat significant loss in cases where most of the information is provided via additional display.

In the end, Google Earth is currently the only reasonably complete KML browser (that I’m aware of). Google Maps and Virtual Earth are slowly improving, and OpenLayers is moving forward as well. I look forward to seeing continued development, and am hopeful that the open source geospatial community can build UIs around data like KML that allow the feature rich presentational options that are currently available via KML in Google Earth — even if we’re only in 2d space. Solving the problems of implementing a format as far-reaching as KML is quite a task, and I’m enjoying watching as users demonstrate their interest in a particular set of features by helping to implement them, and look forward to continuing to see the trend of high quality presentations of geographic material grow, both in KML and other arenas.

OpenLayers: Not quite Kool-Aid

Posted in OpenLayers, Quotes on March 2nd, 2008 at 23:51:06

Is OpenLayers Kool-Aid for developers? Not quite, according to Andrew Turner:

OpenLayers is more like “Here’s some sugar cane: Make something with it.”

— IRC