Archive for the 'Locality and Space' Category

Client Side Storage Engine and OpenLayers

Posted in Locality and Space, OpenLayers on April 15th, 2008 at 21:26:16

Using Client Side Storage for Mapping — a proof of concept which saves locally drawn features either via HTML5 Offline Storage or the same from Google Gears.

OpenLayers 2.6 Release

Posted in Locality and Space, OpenLayers on April 15th, 2008 at 20:12:06

After a long, long haul, r6945 tags OpenLayers 2.6 as a final release.

The OpenLayers Development Team is proud to announce release of OpenLayers 2.6. As of this final release, the OpenLayers 2.6 release closes 294 outstanding tickets. This is the largest of any OpenLayers release to date.

Client side reprojection! Smooth commercial layer panning! KML styling support and pretty, auto-sizing popups! Improved styling support! And lots more.

Six months in the making, this is the best OpenLayers release ever. (And only two RCs! A new record. Here’s hoping that’s not just because we had no testers… ;))

Use 2.6 today!

OpenLayers 2.6 in testing…

Posted in OpenLayers on April 11th, 2008 at 06:20:39

Just a reminder: If you use OpenLayers in your applications, Now Is The Time to test out 2.6 and make sure that it doesn’t break anything. We’re currently in RC, and we’re getting pretty close to cutting a final release if no one complains.

The RC2 Announcement has more info on how to get set up with OpenLayers 2.6.

Choropleth Maps with OpenLayers 2.6

Posted in Locality and Space, OpenLayers on April 5th, 2008 at 15:36:27

OpenLayers 2.6 adds some cool mechanisms for doing your styling on the client side: allowing you to use attributes of your data to create styling information on the fly.

A couple days ago, there was a post about using GeoJSON for thematic mapping. The conclusion of that post puts the blame in the wrong place: “Conclusion: GeoJSON has a lot of potential, but is currently not suitable for world maps due to browser restrictions.” was the conclusion, but this is the case for all formats: nothing here is specific to GeoJSON. It also stated that Firefox is the best browser for in-browser vector display: this is also wrong, as both Safari and Opera do significantly better with SVG rendering than Firefox or IE.

I’ve moved beyond that, though, and wanted to look at various ways to style the data.

The original map was essentially only styled by using data built into the GeoJSON for storing attribute color. Clearly this is not ideal: embedding styling information with the data is great when you want to control the user experience, but seperating it allows application developers more control. Luckily, with the upcoming release of OpenLayers (OpenLayers 2.6), you can do this styling in the browser.

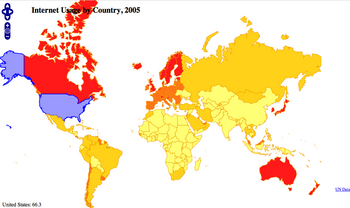
This choropleth map uses the same data as the example in the Thematic Mapping blog post, but instead of taking the style rules from the data, creates a graduated color set. (I don’t know what this is actually called: Thematic mapping isn’t my gig.) Looking at the code, it’s easy to see the color ranges: 0 -> 10, 10-> 20, 20->50, 50->100. (The theme is separated into a separate function for readability.) No base map: we don’t need one for the visual effect to be reasonably pronounced. We get a worldwide, colored map of internet users (in 2005), with attribution and the ability to hover over a country to see its statistics.

But wait, there’s more!

OpenLayers 2.6 has reprojection support: the ability to change the projection of data. So, we can reproject the map into mercator. This is actually a useful educational map: you can see that different projections show significantly different percentages of the world as being covered with high-percentage of internet users.

Anyway, threw it together, and thought it was cool.

GSMLoc Cell Data

Posted in gsmloc, Locality and Space on March 15th, 2008 at 11:24:30

A couple people have asked me over the years what I plan to do with GSMLoc.org. I think that every time I’ve answered, I’ve wished I could say “I have great plans!”… but I don’t.

Until now, I didn’t have a good dump of the data made automatically available. This was silly. I’ve now created a cronjob that will, at midnight, create a gzipped csv dump of the data.

I make no claims as to the quality of this data, and place no restrictions on it, though credit to gsmloc.org or the gsmloc project would be cool.

Sorry that I’ve been so lazy about not making this available. I may still clean up the website, and I’ll gladly link to other projects who are doing the same thing, and I’m sorry that I’ve been such a bad steward over the past couple years.

Why Open Source Matters: Control

Posted in ESRI, Locality and Space, Social on March 12th, 2008 at 10:58:29

Jo Cook writes about ESRI’s crackdown on licensing:

In what can only be described as a noble act of self-sacrifice, ESRI have told us that as an educational charity we are no longer allowed to have an educational discount for using their software and, not only that, our license codes will cease to work at the end of this month.

This is why Open Source software is so important. So you think you have a stable relationship with your vendor? Maybe you think that you’ve come to a great licensing agreement that you’re happy with? Remember that so long as you’re working in an environment where someone else controls the tools you use, you’re not able to make your own rules.

Why does Open Source software matter? If you’re not using it, you’re handing over control of your use of your tools — possibly important ones — to people who aren’t under your control. In the end, that lack of control may end up hurting you far more than you’d expect.

KML: HTML for the Geoweb

Posted in Google Earth, Google Maps, KML, Locality and Space, OpenLayers on March 3rd, 2008 at 00:54:17

KML has become the “HTML” of the Geographic Web. With limited semantic meaning, a combination of mostly-human understandable XML tags for the majority of the usages, widespread use and abuse for purposes far beyond the original thoughts and intentions of the designers, and more, KML fits well into the geographic version of the niche filled by HTML in more generalized content publishing.

Google Earth loads *content* over the web, rather than loading code like Google Maps mashups do. The difference is important: Google Earth ‘mashups’ generate content which is, to some extent reusable within other applications. Google Maps mashups don’t: they tend to use hidden databases without public APIs, and the HTML and code that you do see is executable code, not content.

The content that is generated is reasonably easy to follow: KML is reasonably close to human readable. There doesn’t tend to be a lot of extra XML that confuses users: similar to HTML, it can be edited, for the most part, in a text editor with limited difficulty. There’s a caveat to this, however: editing geographic information — the actual coordinates behind a ‘FlyTo’ — is something that humans don’t have an innate ability to do.

To this problem, Google Earth offers a solution: In addition to being a KML viewer, it’s also a KML *generator* — draw any type of feature you like, style it how you like, then just select the item and ‘copy’ the item, and paste it into a text editor: You immediately have a working KML file, with coordinates that you created. WYSIWYG editing, built right into the data browser. Google Earth acts as the ‘view source’ button for the geoweb.

To some extent, this is extremely handy: users now have the ability to trivially create styled content in Google Earth, export it, and mix and mash these items together to create their own customized feed of data. However, this democratization is exactly the reason that KML does fit the bill of the “HTML of the GeoWeb”, with its pitfall as well as its benefits.

One of the key aspects of the difference between “paleogeographers” and neogeographers is the difference in the importance of accuracy. (I use the terms lightly here, since I don’t tend to categorize users in that way, but it provides a spectrum which is useful to understand.) In general, GIS professionals — regardless of what toolset they’re using, be it Google Earth or ESRI ArcMap — have a need for an understanding of the quality of their data. It doesn’t have to be perfect for all cases, but knowing how good it is or isn’t is an important distinction when you’re going to make decisions based on it. Google Earth doesn’t make including information like this a part of the KML workflow, nor did KML accommodate this type of usage very well until relatively recently.

Information like attributes of a feature, source data — in fact, metadata at all — and so on, is largely left out of the realm of KML. Similar to HTML, it’s largely treated as a ‘presentation’ language by the majority of the users of it. (FeatureServer uses it in a different way, and OpenLayers mimicks that usage, but that’s the exception, not the rule.) Although HTML in an ideal world separates style from substance — using CSS, semantically correct tags, etc. — I think that most web developers have seen too many uses of <table> for layout to believe that that ideal world actually exists. Similarly, KML has support for many features that users will never use. Separation of content and style is possible, but not as widely used, and mixing presentation with content (in terms of application-style control) is the best practice behavior for KML.

I’ve seen continued belief by some users that KML is a geographic data interchange format. Although exchanging geographic data via KML is possible, it’s not an interchange format for data: it’ s primarily an interchange format for presentation. Tools like GDAL and other geodata libraries do their ‘best guess’ interpretation of this data as geographic data, but are not well suited for presentation, only data interchange.

OpenLayers, on the other hand, is in a position where presentation can be taken into account. The newest version of OpenLayers has support for a fair amount of KML styling: other than differing default styles, this KML file looks pretty similar in OpenLayers and Google Maps. However, even here you can see the comparative limitations: Since OpenLayers is primarily about rendering maps, the ‘extras’ around the outside are lost, a somewhat significant loss in cases where most of the information is provided via additional display.

In the end, Google Earth is currently the only reasonably complete KML browser (that I’m aware of). Google Maps and Virtual Earth are slowly improving, and OpenLayers is moving forward as well. I look forward to seeing continued development, and am hopeful that the open source geospatial community can build UIs around data like KML that allow the feature rich presentational options that are currently available via KML in Google Earth — even if we’re only in 2d space. Solving the problems of implementing a format as far-reaching as KML is quite a task, and I’m enjoying watching as users demonstrate their interest in a particular set of features by helping to implement them, and look forward to continuing to see the trend of high quality presentations of geographic material grow, both in KML and other arenas.
OpenLayers: Not quite Kool-Aid

Posted in OpenLayers, Quotes on March 2nd, 2008 at 23:51:06

Is OpenLayers Kool-Aid for developers? Not quite, according to Andrew Turner:

OpenLayers is more like “Here’s some sugar cane: Make something with it.”

— IRC

Island Vacation

Posted in Locality and Space on February 15th, 2008 at 18:03:49

I’m leaving soon for an island vacation, to Grand Cayman after researching for tropical places to visit and browsing around. I won’t be back until Feb 24th.

In the meantime, I want to know what killer apps people have in mind for OpenLayers. What should someone build with it? Why? How would it help OpenLayers, and how would it help the world at large?

See ya’ll on the flip side.

JOSM on EeePC

Posted in eeepc, Locality and Space, OpenStreetMap on January 26th, 2008 at 09:13:40

JOSM is the ‘advanced’ OpenStreetMap editor, used by most technical users of OpenStreetMap. It is written in Java, but despite that 😉 it works reasonably well. Jokes about Java aside, JOSM is an excellent example of the type of ‘advanced’ editor that most GIS professionals would feel comfortable with* after some work understanding OSM: it has familiar interfaces for drawing lines, displaying and editing attributes, etc.

It works well on the eeepc: Java comes pre-installed, so it’s simple to get started; just download josm-latest.jar from the josm homepage and run (from a terminal) ‘java -jar josm-latest.jar’. You’ll be presented with a message that you can’t read, but it’s not really important. (The reason you can’t read it is that the message is apparently laid out with ‘fixed’ border sizes of ~350px… meaning the message only has about 100px across on the eee’s screen. “Oops.”)

First, we’ll set up the interface so it has more room for attribute values on the right hand side, by hiding the command history (Alt-O) and the selection list (Alt-E). You can bring these back at any time using the same shortcuts.

Next, we’ll download some data. The easiest way to download data for an area you’re interested in is to navigate one of the ‘slippy maps’ that OpenStreetMap has: my personal preference is to use Information Freeway, since it has a full page map. To see the area I’ve been mapping in, check out Grand Cayman; you can use this URL in JOSM by copying it, then selecting “File”, “Download From OSM”.

Navigating the map once you’ve downloaded it isn’t too difficult: by default, you’re in ‘zoom’ mode, which will do a ‘rubber band zoom’ (As we call it in OpenLayers) by default. You can switch modes using hte keyboard: simply hit ‘s’ (for select), ‘a’, for add, ‘d’, for delete, or ‘z’ to go back to the default ‘zoom’ mode. Moving the map can be done with Right click->Drag, and the arrow keys can also be used for navigation if you hold down ‘Control’. Zooming in and out can be done with the ‘scrollwheel’, which on the Eee is the right hand side of the trackpad.

In general, the editing experience of JOSM on the eee is actually significantly better than my mac. The reason for this is simple — the Mac doesn’t have a right click, which means that navigating by dragging the map doesn’t work. Additionally, one of the ways to get information about nodes near your cursor is the middle click. On the Eee, this is as simple as tapping two fingers on the trackpad.

That said, there are some significantly lacking aspects in using JOSM on such a small screen that don’t come up on the Mac:

  • Toolbar is too tall — can’t select buttons towards the bottom of the list
  • Preferences dialog is too small: can’t see the ‘okay’ button, so can’t enable plugins (one of the coolest aspects of JOSM)
  • Inability to resize right hand side control panels: this means that the ‘layer switcher’ panel is as tall as the tags panel, which isn’t really neccesary for me. Similarly, ‘relations’ (Which are seldom used, at least at this point) share equal play time with tags/attributes, which is somewhat unneccesary

All in all, JOSM doesn’t work out too bad on the EeePC, but the lack of plugins due to the preferences panel being ‘too tall’ is somewhat annoying, and I haven’t yet figured out how to get around it. It’s possible that installing the plugins manually will work okay, but it’s been so long since I’ve installed them from within JOSM that I don’t even know how anymore!

* Of course, many GIS professionals working with OSM are going to have a steep learning curve, due to the nature of OSM’s data model: the majority of the vectorization software (at least, the stuff that I’ve seen) works with features, whereas OSM is topological, which makes interacting with the data a very different experience.